- Review
- Open access
- Published:
A review on process-oriented approaches for analyzing novice solutions to programming problems
Research and Practice in Technology Enhanced Learning volume 15, Article number: 8 (2020)
Abstract
High attrition and dropout rates are common in introductory programming courses. One of the reasons students drop out is loss of motivation due to the lack of feedback and proper assessment of their progress. Hence, a process-oriented approach is needed in assessing programming progress, which entails examining and measuring students’ compilation behaviors and source codes. This paper reviews the elements of a process-oriented approach including previous studies that have used this approach. Specific metrics covered are Jadud’s Error Quotient, the Watwin Score, Probabilistic Distance to Solution, Normalized Programming State Model, and the Repeated Error Density.
Introduction
Programming is essentially a difficult subject to learn. This is evident in the increasing failure and dropout rates among novice programmers in their introductory programming courses (Bennedsen and Caspersen 2007; Yadin 2011; Watson and Li 2014; Horton and Craig 2015). Several studies had been conducted to pinpoint what could have contributed to these high attrition rates (Kori et al. 2015; Simon et al. 2006; Kinnunen and Malmi 2006; Gomes and Mendes 2007; Biggers et al. 2008; Moström 2011; Mhashi and Alakeel 2013; Simon et al. 2013; Adu-Manusarpong et al. 2013; Vivian et al. 2013), and one of the prominent reasons is the lack of problem-solving skills (Carbone et al. 2009; Falkner and Falkner 2012). Results also showed that time management strategies, effort, and lack of design and programming ability were among the primary reasons for their struggles in programming (Vivian et al. 2013). Most novice programmers go into coding immediately without clearly defining the specific tasks needed to be done. They engage in trial and error (Carbone et al. 2009; Vee et al. 2006a) and rely mostly from the compiler’s feedback for error correction (Carbone et al. 2009; Jadud 2005). When students tend to depend solely from the compiler, they could easily get discouraged whenever they hit a roadblock and cannot get themselves “unstuck” from an error after exhausting all the strategies they are familiar with. Students who portray this characteristic are called stoppers (Perkins et al. 1986).
This scenario involving novice programmers is common not only during actual programming exercises in school but also at the comforts of their home when attempting to work on solutions to their programming assignments. This is very frustrating to students causing them to possibly disengage from what they are trying to solve. Their lack of interest to carry on with their solutions could persist making them less inspired to learn further about programming. This is seen as a likely threat to students who are under pressure and those who have become less motivated because studies have shown that there is a link between student motivation and success in learning to program (Carbone et al. 2009).
Programming teachers, on the other hand, have little or no way of knowing the real hardships students face and the progress that they make along the way since the teachers only see the final outputs submitted to them. Teachers possibly do not even realize to what extent their students’ are capable of writing correct programs (Jadud 2005). This is the problem when students are being assessed traditionally. Giving students performance-based conventional assessments such as take-home programming assignments, examinations (e.g., requiring students to come up with code fragments), and charettes (e.g., short programming assignments carried out in a fixed-time laboratory sessions) (McCracken et al. 2001) and grading only their final outputs do not take into account the students’ intentions (Johnson 1984) and the process that led to their final submissions (Lane and VanLehn 2005). Programming should be regarded as not just merely about code generation but also as a means to reflect how students think, decompose, and solve problems (Marion et al. 2007).
It is for this reason that it is important that students’ intermediate results be likewise considered rather than just the completed output. This kind of approach could possibly address one of the challenges of novice student instruction in Computer Science and other related disciplines, that is, how to keep the students’ interest in programming. It is believed that the key to keep them motivated is to help them succeed in their early programming courses. Students must not only possess the skills but also the motivation to succeed in learning (Helme and Clarke 2001). Hence, if teachers can help keep their students’ interest in their early programming courses at bay, then there is a greater chance that attrition could be reduced. One way to do this is to use a process-oriented style of gauging their work (Worsley and Blikstein 2013).
The goal of this paper is to discuss the following: (1) process-oriented approach in programming and its potential benefits, (2) elements of a process-oriented approach, (3) studies conducted using this approach in the context of novice programming with focus on data collection, and (4) some metrics used in this approach.
A process-oriented approach in programming
Programming in itself is a process, and hence, the process that students undertake in developing a solution to a computer problem must also be evaluated. A completed source code weakly represents the student’s knowledge and skills needed to create it (Lane and VanLehn 2005) because when a student’s final work is solely graded, it is not possible to ascertain the student’s level of ability since that single grade is a combination of several factors (Winters and Payne 2005). A final grade alone as a metric is neither valid nor reliable to deduce about the student’s ability to write codes (Cardell-Oliver 2011). As such, it is proposed that using more complex metrics is more suitable in assessing students’ work in the process of coming up with the final solution.
These metrics, which are based on students’ progress, code, or behavior, are called data-driven metrics (Petersen et al. 2015). Examples of these metrics are the Intention-Based Score (IBS) (Lane and VanLehn 2005) also known as degree of closeness (Helme and Clarke 2001), Error Quotient (EQ) (Jadud 2005), Watwin Score (WS) (Watson et al. 2013), Probabilistic Distance to Solution (PDS) (Sudol et al. 2012), and the more recent Normalized Programming State Model (NPSM) (Carter et al. 2015) and Repeated Error Density (RED) (Becker 2016).
A process-oriented method of assessing open-ended problems (Johnson et al. 2013), such as in programming, is about capturing students’ intermediate works and using a suitable metric to account for students’ learning and behavior. In this approach, the process of producing the final output is examined in an attempt to see the students’ progression while solving the problem. The data that can be captured in the course of program development can be turned into meaningful information to help teachers see if students understand the programming concepts used (Pettit et al. 2012). With this chronological data progression, it is possible to recreate the problem-solving steps the student makes (Vee et al. 2006a), giving a glimpse of how each student advances toward a solution.
Patterns can also be observed from this kind of data, and analyzing such patterns can give teachers and researchers alike an indication of students’ behavior and learning process, which can be a fertile ground for research. Examples of these patterns that can be extracted are programming behavioral patterns such as debugging (Ahmadzadeh et al. 2005), compilation, and coding (Vee et al. 2006a; Spacco et al. 2006); patterns depicting practices common to successful students but not to struggling students (Norris et al. 2008); problem-solving strategies (Kiesmueller et al. 2010; Hosseini et al. 2014) and anomalies (Helminen et al. 2012); submission patterns (Falkner and Falkner 2012; Allevato et al. 2008); and code evolutions (Piech et al. 2012; Blikstein 2011). The possibility of cheating and the effect of starting late on projects can also be traced from these patterns (Fenwick et al. 2009) as well as distinguishing experienced students from poorly performing students (Annamaa et al. 2015; Leinonen et al. 2016). The data collected can also be explored to predict student performance identifying at-risk students in programming (Tabanao et al. 2008; 2011; Falkner and Falkner 2012; Watson et al. 2013; Koprinska et al. 2015) with the aim of providing them tailored remedial instructions. Capturing and analyzing these patterns as a result of using a process-oriented approach is indeed important as it can provide significant help to teachers to vary their strategies for the benefit of the students.
The use of a process-oriented approach in programming is a win-win situation for both teachers and students. Teachers can gain meaningful insights about how students move toward a solution and be able to judge their programming proficiency as well as provide the necessary remedial actions. Students, on the other hand, would appreciate if their teachers would inform them how their work would be assessed, provide them with intermediate feedback to encourage them more (Hattie and Timperley 2007), and award them the grade that would truly measure their progress. If no forms of instructional interventions are afforded, students would be left clueless as to where they have gone wrong and consequently would probably choose to drop out when they get discouraged.
Elements of a process-oriented approach and studies conducted
Using a process-oriented approach of assessing students’ work entails a decision on how data will be collected, how much data will be captured, and how frequent the data will be stored. For this approach to effectively work, data must be acquired automatically from students during their actual programming sessions using some tools or programming environment (Jadud 2005). All source codes produced, together with other pertinent related information, are gathered. For instance, all students’ behavior during programming sessions are captured every time they interact with the compiler or engage with the programming environment used. Hence, the analysis of the compilation behavior is dependent on the automatic collection of source codes written by students while programming. Per the work of Jadud (2005), the observations are not dependent on a researcher observing the subjects but it is actually the computer that does the entire job of automatically capturing and storing the students’ interaction with it. The term online protocol is used to refer to this sort of data. Precisely, an online protocol is a collection of files submitted to a compiler that gives a chain of snapshots (Lane and VanLehn 2005) representing the programmers’ in-between thought processes and hence has the capability to capture not only the final submissions but also the entire history of program development.
In developing an online protocol, the granularity of data must be decided. Different data granularity levels were identified (Koprinska et al. 2015): (1) submission-level data—stores submitted source codes; (2) snapshot-level data—stores file saves, compilations, and executions; and (3) keystroke-level data—stores data every time a student makes changes in the source code. These levels of data granularity are ordered as follows from the finest to coarsest (Ihantola et al. 2015): keystrokes, line-level edits, file saves, compilations, executions, and submissions.
It is important to select the level of granularity that could provide adequate and reasonable amount of data depending on the analysis needs. If data is collected at the smallest level of detail (e.g., mouse events or keystrokes), then there should be a means to store and handle large volumes of data. Some of these details might not be even relevant anymore. On the other hand, if data is collected at a larger granularity (e.g., assignment submissions), then extracting the necessary information might not be possible. Comparisons of these levels are found in Vihavainen et al. (2014).
Tools that could unobtrusively automate data collection must also be considered. The common tools utilized by researchers that could provide the means for data to be collected systematically are the automated grading systems, IDE instrumentation, version control systems (VCS), and key logging (Ihantola et al. 2015). The granularity of the data is dependent on these tools. For instance, automated grading systems like Web-CAT (Edwards and Perez-Quinones 2008) produce data at the granularity of submissions. Web-CAT is capable of collecting file submissions of the same task repeatedly. Examples of IDE instrumentation tools, which collect data as snapshots, are called third generation approaches (Norris et al. 2008) like Hackystat (file modifications) (Johnson et al. 2003), Jadud’s work (compilation events) (Jadud 2005), Marmoset (file saves) (Spacco et al. 2006), and ClockIt (compilation events) (Norris et al. 2008). VCS analyze source code snapshots at commit points only, whereas key logging offers data collection down to the smallest level of detail such as individual keystroke events.
There is plenty of literature using a process-oriented approach. Table 1 lists studies conducted ordered chronologically by year from 2006 to 2016 using this approach in the context of novice programming. The table shows what has been done, the programming language and tools used along with the data granularity.
Of the 42 studies listed, majority of the data collection was done in Java (26), followed by Python (6), and C++ (2). Five of the studies did not mention the programming language used, while two of the studies were conducted using multiple programming languages (C/Python and C/Python/Java). Since Java was the preferred programming language, it is assumed that this is the reason why BlueJ was the most preferred tool for capturing data. Compilations (11) took the lead when it comes to data granularity followed by a combination of varying levels of granularity with submissions (9) coming in third.
Metrics
In a process-oriented approach, the use of a proper metric in analyzing online protocol is important if the aim is to derive meaningful information from the data collected. The studies listed in Table 1 utilized a combination of different metrics, which is dependent on the information need of the researcher. For the purpose of discussing how these metrics were derived and computed, five of these metrics are discussed. These metrics are Jadud’s Error Quotient (EQ) (Jadud 2006a), Watwin Score (WS) (Watson et al. 2013), Probabilistic Distance to Solution (PDS) (Sudol et al. 2012), Normalized Programming State Model (NPSM) (Carter et al. 2015), and Repeated Error Density (RED) (Becker 2016). The main criterion for selecting these metrics is primarily because these metrics were all used to analyze novice programming behavior to understand better why students drop out early in the course and what possible interventions could be provided. It all started with Jadud’s work, which was subsequently improved by the succeeding metrics by addressing the deficiencies of Jadud’s Error Quotient metric.
Error Quotient
EQ is a metric that measures the number of syntax errors a student encounters in a single programming session (i.e., a sequence of compiles from one class period). This measurement is based on several criteria, such as the (1) number of syntax errors made by a student, (2) the frequency of repeating those syntax errors, and the (3) error’s source location in subsequent compilations. A high EQ is given to students who commit many syntax errors and fail to fix them in between compilations. On the other hand, a low EQ is awarded to students who encounter a small number of syntax errors or who manage to quickly fix the syntax error encountered. The use of EQ permits us to compare student sessions easily.
Given a session of compilation events e1 through en, the EQ is calculated as follows (Jadud 2006a):
Collate: Create consecutive pairs from the events in the session, e.g., (e1, e2), (e2, e3), (e3, e4) up to (en−1, en).
Calculate: Score each pair according to the algorithm presented in Fig. 1.
Fig. 1 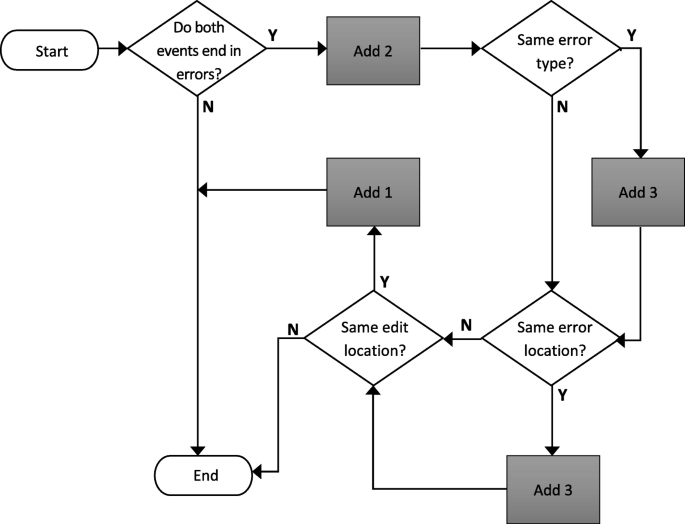
The Error Quotient algorithm flowchart
Normalize: Divide the score assigned to each pair by 9 (the maximum value possible for each pair).
Average: Sum the scores and divide by the number of pairs. This average (in the range 0–1) is taken as the EQ for the session.

To show how the scoring is done, consider the tabular visualization in Fig. 2. The table in this figure is an example of a novice’s compilation session with four events. Each row in the table signifies the change between a pair of successive compilation events. The meanings of the table columns are as follows:
Err type: Denoted with a “ ∗” if a compilation pair was error-free; otherwise, it shows a number representing a known syntax error. This number provides a unique index into the table of recognized syntax errors (e.g., error type no. 8 refers to “Class or interface expected”).
Fig. 2 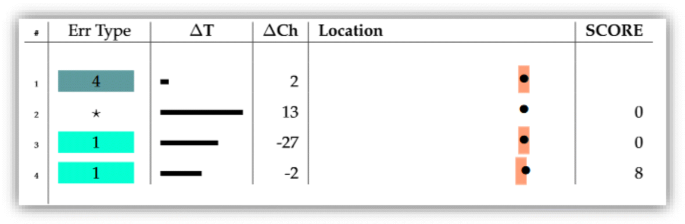
An example of a four-event session (Jadud 2006a)
Δ T: Represents the amount of time (in seconds) that passed between compilations (reduced to five bins: 0–10 s, 20–30 s, 30–60 s, 60–120 s, and more than 2 min). This provides a summary of which compilations were quick and reflexive, and which were done with more thought.
Δ Ch: Tells how many characters were added or removed from one compilation to the next. This gives a sense for the magnitude of the change (e.g., a single character change may mean an addition of a semi-colon as in the case of missing semi-colon error).
Location: Represents the extent of student’s program file (left side: start, right side: furthest point a student edited their program, colored rectangle: location of the syntax error reported, black dot: location of the change made to fix the syntax error)

Scoring begins by taking a pair of events one by one. Referring to Fig. 2, these event pairs are (1, 2), (2, 3), and (3, 4). Taking the first pair and tracing using the flowchart in Fig. 1, it can be verified that both events end in a syntax error. Since the second event is error-free, this pair of events is given a score of zero. This is repeated on the second pair, which also receives zero since the first event incurred no errors. As for the third pair, both events end in a syntax error (add 2), both have the same error type (add 3), and both have the same error location (add 3) yielding a total of 8. Hence, the three pairs have scores 0, 0, and 8, respectively. The scores are then normalized to 0, 0, and 0.88 resulting to an average penalty of 0.29 (0.88/3) to the pairs. This average over all the pairs is now the EQ of this programming session.
Per Jadud’s experiment, EQ appears to be inversely correlated with grades, which means that students who have low EQ scores are likely to have higher assignment and exam grades in programming than those students with high EQ scores. Further, EQ offers also a possibility as a predictor of students’ academic performance.
Watwin Score
The Watwin algorithm attempted to address the flaws of EQ as the latter only assumes that students either work only on a single source file or linearly work on several files. Watson et al. (2013) found, however, that students can probably work on multiple files. This algorithm also offers considerable improvement by increasing its predictive accuracy in predicting student performance based on the way a student tackles different types of errors when compared to peers by proposing resolve time as a predictor. Students receive penalty based on the amount of time they take to fix an error relative to their peers, which is distributed normally. The algorithm is performed as follows:
Input A set of student programming logs (compilation and invocation) for all files compiled during a session:
- 1.
Prepare a set of successive compilation event pairings using the process shown in Fig. 3.
Fig. 3 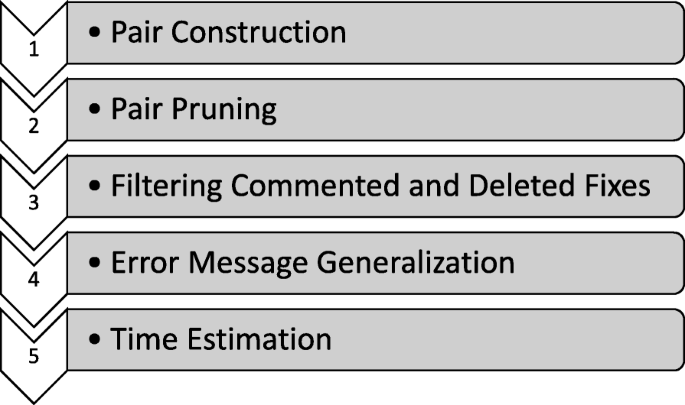
The steps in preparing a set of compilation pairings
- 2.
Quantify programming behavior
Score all compilation pairings generated using the scoring algorithm in Fig. 4.
Fig. 4 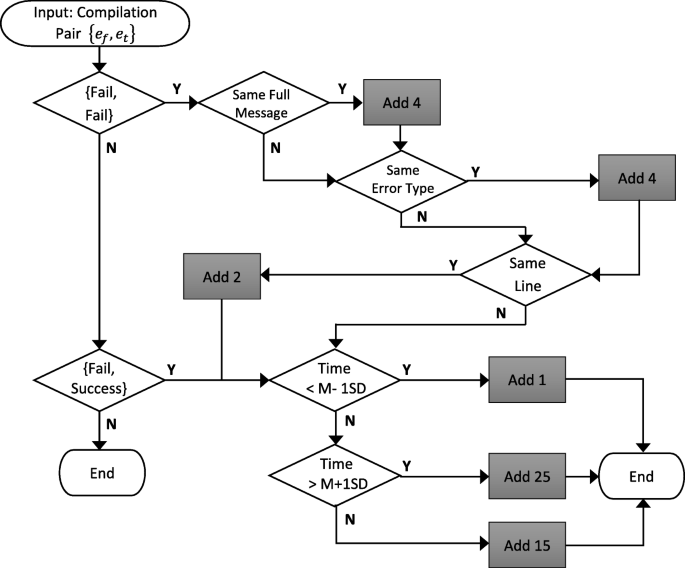
The Watwin Score algorithm
Normalize each score by dividing by 35 (maximum possible score for each pairing).
Average the normalized scores of all pairings.


Output The average of all pairings (in the range 0–1) is taken as the student’s WS for the session. A score of zero denotes that the student’s session is error-free, whereas a score of 1 means that all compilations ended in errors. A score approaching zero indicates that a student is more experienced in programming.
Step 1 in Fig. 3 builds pairs of compilation events {{ e1, e2}, { e2, e3}, …, { en−1, en}} ordered by timestamp on a per file basis. In building such pairs, it considers the possibility where a student works concurrently on multiple files. In step 2, all pairings { ef, et}, whose code snapshots are the same, are identified and removed as these can bloat the total number of compilation pairings. Pairings with a successful event type ef are likewise removed. Deletion and commented fixes are detected in step 3 as these do not reflect a student’s ability in fixing errors. Deletion fixes are spotted by getting the difference ratio between the snapshots of ef and et. The pair { ef, et} is removed if the number of insertions and alterations is zero and if that of deletions is greater than zero. Commented fixes are spotted and removed using a regex expression. In step 4, error messages generated in every compilation event pairs are generalized to build a profile for different classes of errors. Finally, in step 5, the amount of time spent on each compilation pairing { ef, et} is estimated. This is accomplished by creating a combined sequence of invocation and compilation events { h1, h2, …, hk−1, hk} for all files in a session, sorted by timestamp. For every { ef, et}, if there occurs an hi, such that the timestamp of ef>hi>et, the estimated time spent on { ef, et} is computed as the difference between the timestamps of et and hi.
In this approach, resolve time to fix errors is used as a predictor in the scoring model for two reasons: (1) this has not been explored in previous studies prior to the conduct of this research, and (2) the researchers found a strong significant correlation in students’ mean resolve time vis-à-vis performance. As illustrated in the scoring algorithm in Fig. 4, students are penalized if their resolve time is more than one deviation above or below the mean. A low penalty means that students have fixed an error quickly than their peers, and a high penalty signifies that students have fixed an error much slower than their peers. After scoring all pairings, the scores are normalized, and the computed average becomes the WS. The components included and the penalties assigned in the algorithm were not products of random guesswork but were based on previous studies conducted using regression models and cross-validation, hence making this algorithm applicable to independent datasets.
Using a student’s WS as the independent variable, and the students’ overall coursework mark as the dependent variable, a linear regression can be performed to test the predictive power of this algorithm on students’ performance in programming. Moreover, WS can also be used as a classifier of student performance.
Probabilistic Distance to Solution
Traditional metrics for measuring student performance, such as those that depend on the number of submissions or deal with the time spent to correctly finish a programming problem, do not actually reflect student’s understanding and misconceptions about the problem they are solving. In fact, these are considered too coarse-grained to make a distinction between conceptual misunderstanding and syntactical or parsing mistakes made by the students. The PDS metric gives a glimpse of the entire history of problem-solving steps a student takes starting from the first attempt of solving the problem up to the completed solution while providing additional insight into misconceptions and problem-solving paths by focusing on individual algorithmic components within the larger algorithm students are constructing. These algorithmic components, which are used to evaluate student progress, provide a way to determine if a student is making a productive edit (e.g., moving closer to a solution) or an unproductive edit (e.g., does not fix an incorrect algorithmic component of the code), whether engaging in a shotgun debugging or pursuing a misconception.
The idea is, for each submission, the student’s code is converted to a vector of binary features called an alignment vector (AV), which encompasses the algorithmic components (e.g., looping structure, decision structure, use of the loop control in an array access, and inclusion of a return statement), correctness outcomes, and compilation success. The model of required algorithmic elements was based on the work of Sudol-DeLyser (2014). A value of 1 and 0 in the AV represents the appearance and absence of each algorithmic component, respectively. The generated AVs are represented as program states in a network. The model used is useful because it can be seen which individual concepts students struggle and is also useful for tracking and evaluating students’ progress across multiple submissions.
Figure 5 shows a snapshot of a network constructed given a particular problem. The network nodes S1…Sn−1 are possible program states with an end state node F, and the edges represent the observed transitions between states. In the table, columns Fx are the binary program features that correspond to the required algorithmic components for a given problem. Row Sx indicates the presence (green box) or absence (white box) of those features. S0 is the starting state (empty starter code), and S56 represents the correct final state. In the transition graph, the thickness of the edges indicates the number of edits the transition was observed all over the students’ submission, whereas the lengths are arbitrary and do not have something to do with the model. All lines are single directional, indicating a move from the thin side of the line to the thick side.

An example of student program states (Sudol et al. 2012)
Consider, for example, the path S0, S55, S60, and S56. It can be seen from the AV (table in Fig. 5) that from the initial state students submitted a code with a missing component (F8), and then a code with a correct return statement that did not compile before transitioning to the final state. For each node, a Maximum Likelihood Estimate (MLE) transition probability to every other node using the observed transitions is computed. Given the number of observed transitions from state x to state y (Tx,y), the probability of being in state y at time t is estimated with the MLE:
This is equivalent to a Markov chain estimate with a 1-state history.
A classic problem in Computer Science, which is the random walk problem in networks, is applied to the calculation of a PDS particularly referring to the number of likely edits it would take a student from any given node (AV state) to a final state (complete solution). A mean distance from each state to the final state is calculated using a set of linear equations. This is done by modeling each edge as a transition probability and single unit of distance between states. The PDS metric, along with the transition graph (TG) as seen in Fig. 5, can provide substantial information about the paths followed by students in their attempt to arrive at a correct solution. By looking at the PDS and the TG, it is possible to identify if a student has made productive edits or just guessing to fix compiler errors. This is because the AV was generated based on the instructional goals or learning objectives. Hence, its representation and visualization can draw generalizations how program states are parallel to student performance and other latent factors such as learning. For example, in the table in Fig. 5, one student’s first submission is observed as S55 with PDS of 2.99, and the next state it transitioned to is S57 with PDS 4.43. This means that the edit made was less productive since it resulted in a shift to a state with a higher probabilistic number of submits needed to arrive at a correct solution.
Normalized Programming State Model
NPSM differs from EQ and WS in terms of predicting student performance because it determines not only syntactic correctness, but also semantic correctness of a programming solution given at any point in time. Hence, it offers a more holistic predictive model of student performance compared to EQ and WS. NPSM’s approach deals with programming data stream and requires that a student’s current programming solution be mapped into one of the four states in the 2×2 space shown in Fig. 6. The syntactic correctness of a program is determined based on whether the last compilation attempt results in an error. On the other hand, since semantic correctness is not immediately obvious, it cannot be determined right away. The only way to go around this is to look for the presence or absence of runtime exceptions in the last execution attempt. A program is semantically correct if it produces a runtime exception in the last execution attempt. It is semantically unknown if the last execution attempt does not produce a runtime exception.

Dimensions of program correctness
A state-transition diagram found in Carter et al. (2015) is used to map this model to the stream of programming log data provided by the IDE used in this study. The 11 states in the transition diagram along with their codes, for quick viewing, are shown in Table 2.
The editing states in the model, namely YN, YU, NU, and NN, serve as rough proxies representing both the syntactic and semantic status of the program being edited as shown in Fig. 6. It is inferred that students who spend more time in syntactically correct and semantically unknown states will likely to perform better than students spending more time in syntactically and semantically incorrect states. In the RN and DN states, students would seem to ask the question, “Why does not my program work?” and in the RU and DU states, they would be inclined to ask the question, “Does my program work?” Among these states, DN and DU are in a more powerful position to ask these questions since they are using the debugger. Lastly, students who spend time in R/ state may imply that a student is struggling. Overall, the relationship between these five execution states vis-à-vis student performance is not clear.
A student’s programming activity is mapped to one of the 11 states in this model. To correlate the use of this method with student performance, the amount of time a student spent in each state is recorded and the recorded times relative to the total time the student spent programming is normalized. In the preliminary analysis of the data gathered using this model, it was observed that the Idle state was the dominating state of the students, which means that students are likely to spend most of their day not doing any programming activity. Since the focus is on the time students spent in programming, the Idle state was eliminated from the normalization process. One variable was added in the model, which is the time-on-task, leaving a total of 11 data points per students. These 11 data points form the NPSM.
A predictive measure was derived using NPSM to predict performance. Based on previous studies conducted and given that NPSM has 11 predictors, the ideal sample size is estimated at 220 students to achieve full statistical power when deriving the predictive measure. Four states were considered in the development of the predictive model, namely UU, NR, RU, and RN, and multivariate regression was performed using these states. RN and RU are found to be positive contributors to student success, while UU and NU are found to be negative contributors. This suggests that dealing with a program’s runtime behavior, notwithstanding the semantic correctness, is a successful programming approach. On the other hand, writing large chunks of code and not compiling it (UU) does not contribute to programming success, and when students compile, they will be trapped in NU state, which is also found to be negatively correlated with performance. YN and NN are not significant predictors, so they were dropped in this predictive model.
Repeated Error Density
RED is a metric used to quantify repeated errors. It is considered more advantageous compared to Jadud’s EQ since it is less context dependent and is suitable for short sessions. RED has properties making it capable to answer Jadud’s questions, such as (1) “If one student fails to correct an ‘illegal start of expression’ error over the course of three compilations, and another over 10, is one student [about] three times worse than the other?” and (2) “What if the other student deals with a non-stop string of errors, and the repetition of this particular error is just one of many?” Dissecting these questions would mean that when EQ is used as a metric, both students in these cases would have an EQ of 1.
These cases can be demonstrated in the succeeding scenarios. Take students A, B, and C; an error type x; and a repeated error r. Suppose student A logs two consecutive errors of type x resulting in one repeated error r. Is it fair to say that student B who logs three consecutive errors of type x resulting in two repeated errors 2r is struggling with that error more by a factor of two? What about student C who also logs 2r but not all in one string s (say across 2s, by logging two consecutive errors of type x followed by some successful compiles, followed by two more consecutive errors of type x)? Considering all these cases and given the assumption that no other errors are made, and all other variables among the three students are equal, the EQ will be equal to 1 in all cases. Table 3 summarizes these three scenarios.
Table 3 shows that EQ is not of any help. Hence, RED came into the picture to quantify repeated errors by both looking at the amount of repeated error strings a student encounters and looking at the length of these strings. This metric involves summing a submetric calculated on each repeated error string encountered in a compilation event sequence. This submetric is \(r_{i}^{2}\) / |[si]| where |[si]| is the length of the string si containing ri repeated errors. This can be expressed completely in terms of ri as \(r_{i}^{2}\) / (ri+1), since the length of a string si containing ri consecutive errors is always equal to ri+1.
The value of RED for a given sequence S of n repeated error strings for each si in S is shown in the equation below:
RED = \(\sum _{i=1}^{n}\)\( \frac {r_{i}^{2}}{r_{i}+1} \)where ri is the number of repeated error r as a pair of events where each event results in the same error. Table 4 shows the RED values for all sequence combinations for which a total of 0–4 repeated errors are encountered.
In Table 4, sequences 1 and 2 mean that a single occurrence of error x, or two occurrences separated by other activity, does not comprise repeated errors and hence has a RED value of 0. Sequences 4 and 5 illustrate two ways that error x can be repeated twice successively, but sequence 4 is considered the “natural” choice for showing that a student struggles twice of that the student in sequence 3 as evidenced by the RED values of sequence 4 (1) and sequence 3 (0.5) giving a ratio of 2:1. The same can also be observed for sequences 11 and 5. With this, Jadud’s first question was addressed.
For Jadud’s second question, this is addressed by inspecting sequences 5 and 4. Sequence 5 contains one long string of two repeated errors with RED = 1.3, and sequence 4 also has two repeated errors but over two shorter strings and has RED = 1. In this case, a penalty of 1/3 is incurred for a sequence that encounters two repeated errors in one long string. Therefore, it can be said that the student in sequence 5 (B) is struggling more with error x than the student in sequence 4 (C) as reflected by the former’s higher RED score.
It can be observed that Jadud’s EQ has become the basis of the creation of other metrics. Newer metrics had been developed to address the shortcoming of the older metrics. As data evolve and as the need for answers are being sought, more suitable and better metrics will come to exist in the near future. Table 5 shows a comparison matrix of the five metrics along with their advantages and disadvantages.
Conclusion
Programming is perceived to be difficult particularly among novices as evidenced by the increasing dropout and attrition rates in introductory programming courses. Computing educators and researchers have endeavored to pinpoint the underlying problem by analyzing different learning behaviors while writing programs. It is possible that educators may not have a good grasp on the type of errors students normally encounter or have no or very limited idea about the students’ misconceptions in programming. This is because traditionally what is usually required to be submitted and assessed by instructors are the just the final outputs. Hence, there is really no way of knowing the amount of effort students put into their work and the level of understanding students have about their programming assignments.
This paper discusses what is a process-oriented approach of analyzing students’ programming solutions. This approach not only takes into account the final submissions of the students but also captures the progress the students make in writing programs. In using a process-oriented approach, online protocols (e.g., sequences of automatically collected source codes written by students while writing a solution to a programming problem) must be first be collected by deciding the level of data granularity to use. This approach could be beneficial to computing educators, students, and researchers. Capturing and analyzing students’ online programming protocols has the potential of providing computing educators meaningful insights about how students behave a certain way during programming sessions and the processes by which they learn to program. This information is useful to computer educators and course designers so that they can create tailored interventions and adjust course materials accordingly. Educators may also be particularly interested in identifying at-risk students and what specific programming areas they are struggling with. Programming students could receive help from appropriate feedbacks and not just rely from the compilers’ feedbacks which are not encouraging at all to novice programmers. This is an ideal pedagogical situation that could possibly increase the retention rates in programming courses.
The application and limitations of data-driven metrics covered in this paper were examined in more recent studies. For instance, since EQ’s drawbacks include being context dependent and containing free parameters, Petersen et al. (2015) investigated the application of EQ in a multi-context setting to determine its sensitivity to different contexts. Significant differences in the predictive power of EQ across contexts were shown. The researchers were not able to find a model that effectively predicted performance, and even if a model existed, the effectiveness was highly dependent on the parameters chosen. Ahadi et al. (2015) then proposed an improvement to EQ that measures coding progression using source code snapshot metadata. This newer metric is no longer context-sensitive and language dependent, and does not suffer from ad hoc parameters. In a study by Watson et al. (2012) and Becker et al. (2018), it was suggested that enhanced syntax error messages could improve students’ performance. However, this was argued by Denny et al. (2014) indicating that syntax error messages do not work all the time. It is possible that the differences in their results are due to differences in contexts. It is imperative, therefore, that data-driven metrics used for assessing student behaviors must be examined across a wide variety of teaching contexts and situations. More effective strategies for automatically tweaking the metrics to make them suitable in different contexts must also be developed.
In a much recent study by Carter and Hundhausen (2017), tracing Programming State Model (PSM) programming sequences can detect a student’s programming ability and can be used as a platform to provide customized learning interventions to students learning how to program. There is also empirical proof that students have different ways of tackling programming assignments depending on their level of achievement. However, it was found that using automatically generated log data is incapable of connecting a student’s intention to his/her programming processes. Hence, data collected must be augmented with alternate sources like lab observations and/or reflective dialogues to get the learner’s intent correctly.
The study of Carter et al. (2017) likewise confirms that EQ and WS as predictive models differ considerably based on setting. NPSM, on the other hand, outperforms these metrics as a predictor because NPSM is not affected by the programming environments and languages used in the studies. Whereas prior studies attempted to predict student achievement based on the students’ programming data, this recent study have incorporated non-programming data, specifically online social behavior (e.g., participation levels in completing programming assignments), to investigate whether this would have an effect on the predictive power of EQ, WS, and NPSM on the academic success of students. Results showed that combining a programming-based metric with participation level measure could indeed add more explanatory power into the predictive models. However, to extend the generalizability of these predictive measures, more replication studies need to be conducted considering different student populations. This is especially true for NPSM, which, according to previous studies, happens to have a limitation in terms of its explanatory power. A replication study using the same settings should be conducted to verify if this limitation still exists.
Availability of data and materials
Not applicable
Abbreviations
- EQ:
-
Error quotient
- WS:
-
Watwin Score
- PDS:
-
Probabilistic Distance to Solution
- NPSM:
-
Normalized Programming State Model
- RED:
-
Repeated Error Density
References
Adu-Manusarpong, K., Arthur, J.K., Amoako, P.Y.O. (2013). Causes of failure of students in computer programming courses: The teacher learner perspective. International Journal of Computer Applications, 7(12), 27–32.
Ahadi, A., Lister, R., Haapala, H., Vihavainen, A. (2015). Exploring machine learning methods to automatically identify students in need of assistance. In Proceedings of the Eleventh Annual International Conference on International Computing Education Research. ACM, New York, (pp. 121–130).
Ahmadzadeh, M., Elliman, D., Higgins, C. (2005). An analysis of patterns of debugging among novice computer science students. SIGCSE Bull, 37(3), 84–88.
Allevato, A., & Edwards, S.H. (2010). Discovering patterns in student activity on programming assignments. In ASEE Southeastern Section Annual Conference and Meeting.
Allevato, A., Thornton, M., Edwards, S., Perez-Quinones, M. (2008). Mining data from an automated grading and testing system by adding rich reporting capabilities. Educational Data Mining.
Altadmri, A., & Brown, N.C.C. (2015). 37 million compilations: Investigating novice programming mistakes in large-scale student data. In Proceedings of the 46th ACM Technical Symposium on Computer Science Education. ACM, New York, (pp. 522–527).
Annamaa, A., Hansalu, A., Tonisson, E. (2015). Automatic analysis of students’ solving process in programming exercises. In IFIP TC3 Working Conference “A New Culture of Learning: Computing and next Generations”.
Becker, B.A. (2016). A new metric to quantify repeated compiler errors for novice programmers. In Proceedings of the 2016 ACM Conference on Innovation and Technology in Computer Science Education. ACM, New York, (pp. 296–301).
Becker, B.A., Goslin, K., Glanville, G. (2018). The effects of enhanced compiler error messages on a syntax error debugging test. In Proceedings of the 49th ACM Technical Symposium on Computer Science Education (SIGCSE ’18). ACM, New York, (pp. 640–645).
Bennedsen, J., & Caspersen, M.E. (2007). Failure rates in introductory programming. SIGCSE Bull, 39(2), 32–36.
Biggers, M., Brauer, A., Yilmaz, T. (2008). Student perceptions of computer science: A retention study comparing graduating seniors with cs leavers. In Proceedings of the 39th SIGCSE Technical Symposium on Computer Science Education. ACM, New York, (pp. 402–406).
Blikstein, P. (2011). Using learning analytics to assess students’ behavior in open-ended programming tasks. In Proceedings of the 1st International Conference on Learning Analytics and Knowledge. ACM, New York, (pp. 110–116).
Blikstein, P., Worsley, M., Piech, C., Sahami, M., Cooper, S., Koller, D. (2014). Programming pluralism: Using learning analytics to detect patterns in the learning of computer programming. Journal of the Learning Sciences, 23(4), 561–599.
Carbone, A., Hurst, J., Mitchell, I., Gunstone, D. (2009). An exploration of internal factors influencing student learning of programming. In Proceedings of the Eleventh Australasian Conference on Computing Education - Volume 95. Australian Computer Society, Inc, Darlinghurst, (pp. 25–34).
Cardell-Oliver, R (2011). How can software metrics help novice programmers? In Proceedings of the Thirteenth Australasian Computing Education Conference - Volume 114. Australian Computer Society, Inc, Darlinghurst, (pp. 55–62).
Carter, A.S., & Hundhausen, C.D (2017). Using programming process data to detect differences in students’ patterns of programming. In Proceedings of the 2017 ACM SIGCSE Technical Symposium on Computer Science Education (SIGCSE ’17). ACM, New York, (pp. 105–110).
Carter, A.S., Hundhausen, C.D., Adesope, O. (2015). The normalized programming state model: Predicting student performance in computing courses based on programming behavior. In Proceedings of the Eleventh Annual International Conference on International Computing Education Research. ACM, New York, (pp. 141–150).
Carter, A.S., Hundhausen, C.D., Adesope, O. (2017). Blending measures of programming and social behavior into predictive models of student achievement in early computing courses. ACM Transactions on Computing Education (TOCE), 17(3), 1–20.
Denny, P., Luxton-Reilly, A., Carpenter, D. (2014). Enhancing syntax error messages appears ineffectual. In Proceedings of the 2014 Conference on Innovation and Technology in Computer Science Education (ITiCSE ’14). ACM, New York, (pp. 273–278).
Edwards, S.H., & Perez-Quinones, M.A. (2008). Web-cat: Automatically grading programming assignments. SIGCSE Bull, 40(3), 328–328.
Falkner, N.J.G., & Falkner, K.E. (2012). A fast measure for identifying at-risk students in computer science. In Proceedings of the Ninth Annual International Conference on International Computing Education Research. ACM, New York, (pp. 55–62).
Fenwick, Jr., J.B., Norris, C., Barry, F.E., Rountree, J., Spicer, C.J., Cheek, S.D. (2009). Another look at the behaviors of novice programmers. SIGCSE Bull., 41(1), 296–300.
Gatchalian, E. (2014). A comparative analysis of intention-based score trajectories and update characteristics trajectories among novice programming students.
Gomes, A., & Mendes, A.J. (2007). Learning to program-difficulties and solutions. In International Conference on Engineering Education.
Hattie, J., & Timperley, H. (2007). The power of feedback. Review of Educational Research, 77(1), 81–112.
Heinonen, K., Hirvikoski, K., Luukkainen, M., Vihavainen, A. (2014). Using codebrowser to seek differences between novice programmers. In Proceedings of the 45th ACM Technical Symposium on Computer Science Education. ACM, New York, (pp. 229–234).
Helme, S., & Clarke, D. (2001). Identifying cognitive engagement in the mathematics classroom. Mathematics Education Research Journal, 13(2), 133–153.
Helminen, J, Ihantola, P, Karavirta, V (2013). Recording and analyzing in-browser programming sessions. In Proceedings of the 13th Koli Calling International Conference on Computing Education Research. ACM, New York, (pp. 13–22).
Helminen, J., Ihantola, P., Karavirta, V., Malmi, L. (2012). How do students solve parsons programming problems?: An analysis of interaction traces In Proceedings of the Ninth Annual International Conference on International Computing Education Research. ACM, New York, (pp. 119–126).
Horton, D., & Craig, M. (2015). Drop, fail, pass, continue: Persistence in cs1 and beyond in traditional and inverted delivery. In Proceedings of the 46th ACM Technical Symposium on Computer Science Education, SIGCSE ’15. ACM, New York, (pp. 235–240).
Hosseini, R., Vihavainen, A., Brusilovsky, P. (2014). Exploring problem solving paths in a java programming course. In Psychology of Programming Interest Group Conference, (pp. 65–76).
Ihantola, P., Sorva, J., Vihavainen, A. (2014). Automatically detectable indicators of programming assignment difficulty. In Proceedings of the 15th Annual Conference on Information Technology Education. ACM, New York, (pp. 33–38).
Ihantola, P., Vihavainen, A., Ahadi, A., Butler, M., Börstler, J., Edwards, S.H., Isohanni, E., Korhonen, A., Petersen, A., Rivers, K., Rubio, M.A., Sheard, J., Skupas, B., Spacco, J., Szabo, C., Toll, D. (2015). Educational data mining and learning analytics in programming: Literature review and case studies. ACM, New York, (pp. 41–63).
Jadud, M. (2006a). An exploration of novice compilation behaviour in BlueJ. PhD thesis: University of Kent.
Jadud, M.C. (2005). A first look at novice compilation behaviour using bluej. Computer Science Education, 15(1), 25–40.
Jadud, M.C. (2006b). Methods and tools for exploring novice compilation behaviour. In Proceedings of the Second International Workshop on Computing Education Research. ACM, New York, (pp. 73–84).
Johnson, M., Eagle, M., Stamper, J., Barnes, T. (2013). An algorithm for reducing the complexity of interaction networks. Educational Data Mining.
Johnson, P.M., Kou, H., Agustin, J., Chan, C., Moore, C., Miglani, J., Zhen, S., Doane, W.E.J. (2003). Beyond the personal software process: Metrics collection and analysis for the differently disciplined. In Proceedings of the 25th International Conference on Software Engineering. IEEE Computer Society, Washington, DC, (pp. 641–646).
Johnson, W.L.S.E. (1984). Intention-based diagnosis of programming errors. In Proceedings of the Fourth AAAI Conference on Artificial Intelligence. AAAI Press, (pp. 162–168).
Kasurinen, J., & Nikula, U. (2009). Estimating programming knowledge with bayesian knowledge tracing. In Proceedings of the 14th Annual ACM SIGCSE Conference on Innovation and Technology in Computer Science Education. ACM, New York, (pp. 313–317).
Kiesmueller, U., Sossalla, S., Brinda, T., Riedhammer, K. (2010). Online identification of learner problem solving strategies using pattern recognition methods. In Proceedings of the Fifteenth Annual Conference on Innovation and Technology in Computer Science Education. ACM, New York, (pp. 274–278).
Kinnunen, P., & Malmi, L. (2006). Why students drop out cs1 course? In Proceedings of the Second International Workshop on Computing Education Research. ACM, New York, (pp. 97–108).
Koprinska, I., Stretton, J., Yacef, K. (2015). Students at risk: Detection and remediation. Educational Data Mining, 512–515.
Kori, K., Pedaste, M., Tõnisson, E., Palts, T., Altin, H., Rantsus, R., Sell, R., Murtazin, K., Rüütmann, T. (2015). First-year dropout in ICT studies. In 2015 IEEE Global Engineering Education Conference (EDUCON). IEEE.
Lane, H.C., & VanLehn, K. (2005). Intention-based scoring: An approach to measuring success at solving the composition problem. In Proceedings of the 36th SIGCSE Technical Symposium on Computer Science Education. ACM, New York, (pp. 373–377).
Leinonen, J., Longi, K., Klami, A., Vihavainen, A. (2016). Automatic inference of programming performance and experience from typing patterns. In Proceedings of the 47th ACM Technical Symposium on Computing Science Education. ACM, New York, (pp. 132–137).
Marion, B., Impagliazzo, J., St. Clair, C., Soroka, B., Whitfield, D. (2007). Assessing computer science programs: What have we learned, (pp. 131–132).
Matsuzawa, Y., Okada, K., Sakai, S. (2013). Programming process visualizer: A proposal of the tool for students to observe their programming process. In Proceedings of the 18th ACM Conference on Innovation and Technology in Computer Science Education. ACM, New York, (pp. 46–51).
McCracken, M., Almstrum, V., Diaz, D., Guzdial, M., Hagan, D., Kolikant, Y.B.-D., Laxer, C., Thomas, L., Utting, I., Wilusz, T. (2001). A multi-national, multi-institutional study of assessment of programming skills of first-year cs students. In Working Group Reports from ITiCSE on Innovation and Technology in Computer Science Education. ACM, New York, (pp. 125–180).
Mhashi, M, & Alakeel, A.L.I.M (2013). Difficulties facing students in learning computer programming skills at Tabuk University. In Proceedings of the 12th International Conference on Education and Educational Technology, Iwate.
Moström, J.E. (2011). A study of student problems in learning to program. PhD thesis: Umeå University, Department of Computing Science.
Norris, C, Barry, F, Fenwick Jr., J.B, Reid, K, Rountree, J. (2008). Clockit: Collecting quantitative data on how beginning software developers really work, (pp. 37–41). New York: ACM.
Perkins, D.N., Hancock, C., Hobbs, R., Martin, F., Simmons, R. (1986). Conditions of learning in novice programmers. Journal of Educational Computing Research, 2(1), 37–55.
Petersen, A., Spacco, J., Vihavainen, A. (2015). An exploration of error quotient in multiple contexts. In Proceedings of the 15th Koli Calling Conference on Computing Education Research. ACM, New York, (pp. 77–86).
Pettit, R., Clements, R., Mengel, S. (2012). A process for collecting and analyzing chronological data for cs1 programming assignments. In Proceedings of the International Conference on Frontiers in Education: Computer Science and Computer Engineering.
Pettit, R., Homer, J., Gee, R., Mengel, S., Starbuck, A. (2015). An empirical study of iterative improvement in programming assignments. In Proceedings of the 46th ACM Technical Symposium on Computer Science Education. ACM, New York, (pp. 410–415).
Piech, C., Sahami, M., Koller, D., Cooper, S., Blikstein, P. (2012). Modeling how students learn to program. In Proceedings of the 43rd ACM Technical Symposium on Computer Science Education. ACM, New York, (pp. 153–160).
Rodrigo, M.M.T., Baker, R.S., Jadud, M.C., Amarra, A.C.M., Dy, T., Espejo-Lahoz, M.B.V., Lim, S.A.L., Pascua, S.A.M.S., Sugay, J.O., Tabanao, E.S. (2009). Affective and behavioral predictors of novice programmer achievement. In Proceedings of the 14th Annual ACM SIGCSE Conference on Innovation and Technology in Computer Science Education. ACM, New York, (pp. 156–160).
Rodrigo, M.M.T., & Baker, R.S.J.d. (2009). Coarse-grained detection of student frustration in an introductory programming course. In Proceedings of the Fifth International Workshop on Computing Education Research Workshop. ACM, New York, (pp. 75–80).
Rodrigo, M.M.T., Tabanao, E., Lahoz, M.B.E., Jadud, M.C. (2009). Analyzing online protocols to characterize novice java programmers. 138, 2, 177–190.
Simon, B, Lister, R, Fincher, S (2006). Multi-institutional computer science education research: A review of recent studies of novice understanding. In Proceedings. Frontiers in Education. 36th Annual Conference. IEEE.
Simon, B., Parris, J., Spacco, J. (2013). How we teach impacts student learning: Peer instruction vs. lecture in cs0. In Proceeding of the 44th ACM Technical Symposium on Computer Science Education. ACM, New York, (pp. 41–46).
Sirkiä, T., & Sorva, J. (2012). Exploring programming misconceptions: An analysis of student mistakes in visual program simulation exercises. In Proceedings of the 12th Koli Calling International Conference on Computing Education Research. ACM, New York, (pp. 19–28).
Spacco, J., Fossati, D., Stamper, J., Rivers, K. (2013). Towards improving programming habits to create better computer science course outcomes. In Proceedings of the 18th ACM Conference on Innovation and Technology in Computer Science Education. ACM, New York, (pp. 243–248).
Spacco, J., Hovemeyer, D., Pugh, W., Emad, F., Hollingsworth, J.K., Padua-Perez, N. (2006). Experiences with marmoset: Designing and using an advanced submission and testing system for programming courses. SIGCSE Bull., 38(3), 13–17.
Sudol, L.A., Rivers, K., Harris, T.K. (2012). Calculating probabilistic distance to solution in a complex problem solving domain. International Educational Data Mining Society.
Sudol-DeLyser, L.A. (2014). AbstractTutor: Increasing algorithm implementation expertise for novices through algorithmic feedback, PhD thesis: Carnegie Mellon University.
Tabanao, E.S., Rodrigo, M.M.T., Jadud, M.C. (2008). Identifying at-risk novice java programmers through the analysis of online protocols. In Philippine Computing Science Congress, (pp. 1–8).
Tabanao, E.S., Rodrigo, M.M.T., Jadud, M.C. (2011). Predicting at-risk novice java programmers through the analysis of online protocols. In Proceedings of the Seventh International Workshop on Computing Education Research. ACM, New York, (pp. 85–92).
Vee, M.H.N.C., Meyer, B., Mannock, K.L. (2006a). Understanding novice errors and error paths in object-oriented programming through log analysis. In Proceedings of workshop on educational data mining at the 8th international conference on intelligent tutoring systems, (pp. 13–20).
Vee, M.N.C., Meyer, B., Mannock, K.L. (2006b). Empirical study of novice errors and error paths in object oriented programming. In Proceedings of the 7th Annual HEA-ICS Conference.
Vihavainen, A., Helminen, J., Ihantola, P. (2014). How novices tackle their first lines of code in an ide: Analysis of programming session traces. In Proceedings of the 14th Koli Calling International Conference on Computing Education Research. ACM, New York, (pp. 109–116).
Vihavainen, A., Luukkainen, M., Ihantola, P. (2014). Analysis of source code snapshot granularity levels, (pp. 21–26). New York: ACM.
Vivian, R., Falkner, K., Falkner, N. (2013). Computer science students causal attributions for successful and unsuccessful outcomes in programming assignments. In Proceedings of the 13th Koli Calling International Conference on Computing Education Research.
Watson, C., & Li, F.W. (2014). Failure rates in introductory programming revisited. In Proceedings of the 2014 conference on Innovation and technology in computer science education.
Watson, C., Li, F.W.B., Godwin, J.L. (2012). Bluefix: Using crowd-sourced feedback to support programming students in error diagnosis and repair. In Proceedings of the 11th International Conference on Advances in Web-Based Learning (ICWL ’12). Springer-Verlag, Berlin, Heidelberg, (pp. 228–239).
Watson, C., Li, F.W.B., Godwin, J.L. (2013). Predicting performance in an introductory programming course by logging and analyzing student programming behavior. In Proceedings of the 2013 IEEE 13th International Conference on Advanced Learning Technologies. IEEE Computer Society, Washington, DC, (pp. 319–323).
Winters, T., & Payne, T. (2005). What do students know?: An outcomes-based assessment system. In Proceedings of the First International Workshop on Computing Education Research. ACM, New York, (pp. 165–172).
Worsley, M., & Blikstein, P. (2013). Programming pathways: A technique for analyzing novice programmers’ learning trajectories. In: Lane, H.C., Yacef, K., Mostow, J., Pavlik, P. (Eds.) In Artificial Intelligence in Education. AIED 2013. Lecture Notes in Computer Science, volume 7926, Berlin, Heidelberg.
Yadin, A. (2011). Reducing the dropout rate in an introductory programming course. ACM Inroads, 2(4), 71–76.
Acknowledgements
Not applicable
Funding
Not applicable
Author information
Authors and Affiliations
Contributions
MV carried out the review and wrote the manuscript. The author read and approved the final manuscript.
Corresponding author
Ethics declarations
Competing interests
The author declares that there are no competing interests.
Additional information
Publisher’s Note
Springer Nature remains neutral with regard to jurisdictional claims in published maps and institutional affiliations.
Rights and permissions
Open Access This article is licensed under a Creative Commons Attribution 4.0 International License, which permits use, sharing, adaptation, distribution and reproduction in any medium or format, as long as you give appropriate credit to the original author(s) and the source, provide a link to the Creative Commons licence, and indicate if changes were made. The images or other third party material in this article are included in the article’s Creative Commons licence, unless indicated otherwise in a credit line to the material. If material is not included in the article’s Creative Commons licence and your intended use is not permitted by statutory regulation or exceeds the permitted use, you will need to obtain permission directly from the copyright holder. To view a copy of this licence, visit http://creativecommons.org/licenses/by/4.0/.
About this article

Cite this article
Villamor, M.M. A review on process-oriented approaches for analyzing novice solutions to programming problems. RPTEL 15, 8 (2020). https://doi.org/10.1186/s41039-020-00130-y
Received:
Accepted:
Published:
DOI: https://doi.org/10.1186/s41039-020-00130-y